
Introduction
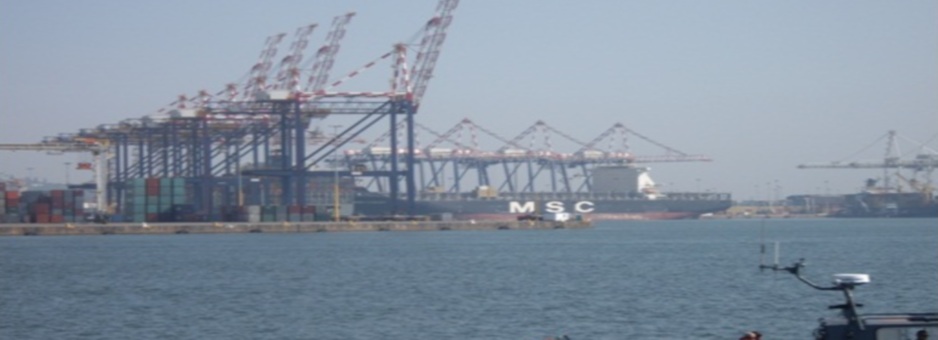
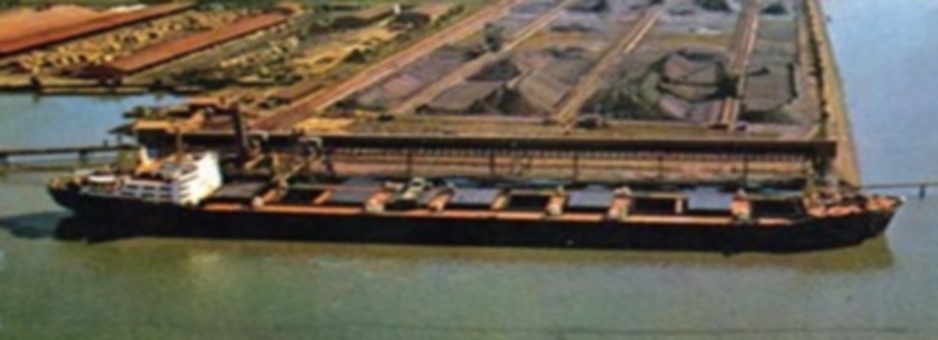
The Port of Durban is primarily a container port, secondly a general bulk cargo and lastly a vehicle handling port.
Port InfrastructureDocumenting the transportation network (support infrastructure such as road, rail, pipelines, etc.) forms the functioning elements of the port. External and internal roads and rail system allow for landside and hinterland cargo movement. In addition, waterside infrastructure inclusive of terminals, quays, berths, equipment form another critical element for effective functioning of the port. These are all presented in this section with respective profiles.
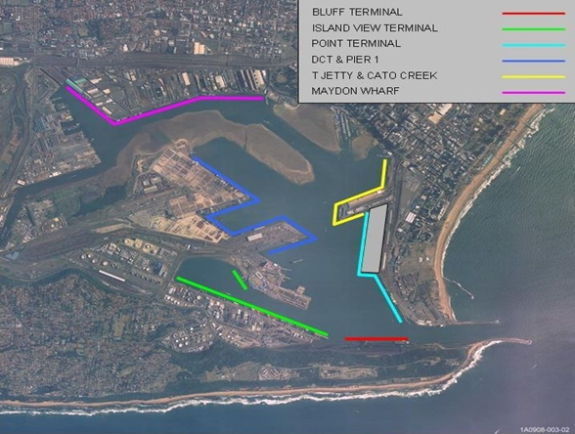
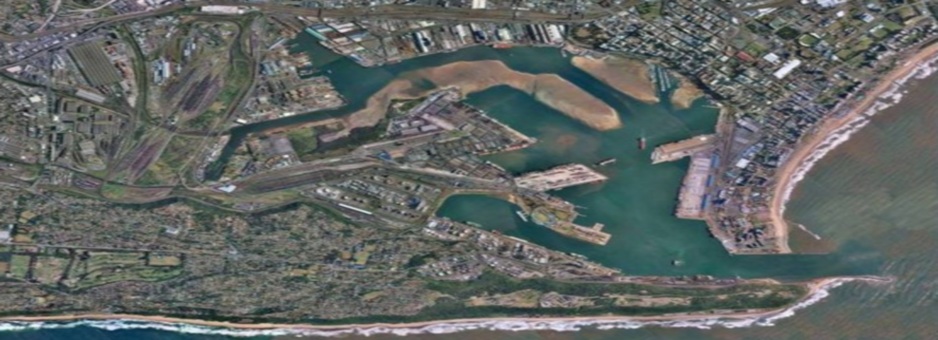
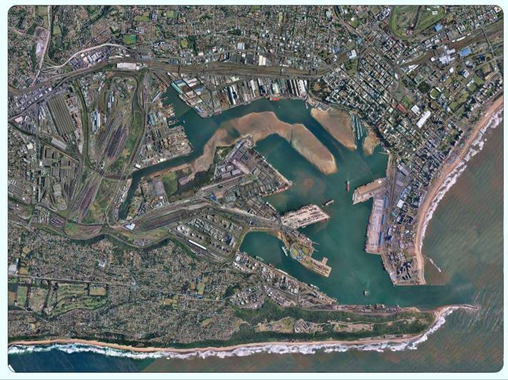
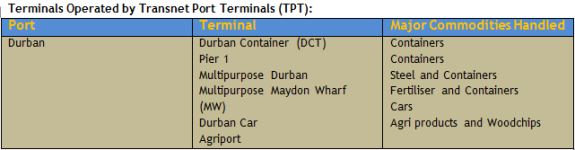
Port Terminals and Port Berth Layout - Source TNPA 2009
Road NetworkThe external street network servicing the port contains the following:
- Edwin Swales Drive - serving Pier 1, Pier 2 and Island View traffic.
- Old South Coast Road - serving Pier 1, 2, Maydon Wharf and Island View traffic.
- Victoria Embankment - serving the Point Precinct, to the east and Maydon Wharf to the south.
- Point Road - Shepstone Road one-way pair - Serving the Point Precinct.
- Bayhead Road - Serving Pier 1, Pier 2 and Island View traffic, Bayhead and Fynnland.
With some exceptions, these roads all suffer from congestion during peak periods due in part to their close proximity to and locations within the Durban CBD. In response to the crushing congestion, Khangela Bridge (a joint venture between Transnet and the Municipality) was finalised in 2009.
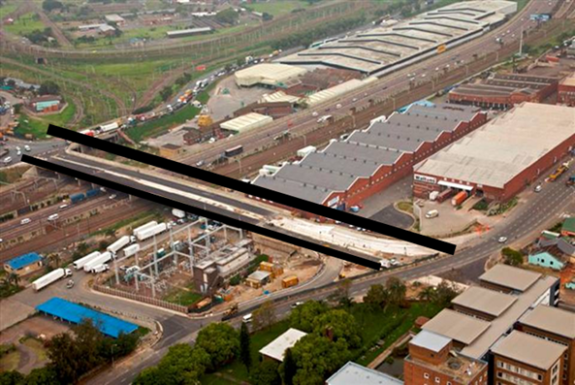
Khangela Bridge - Source Port of Durban 2010
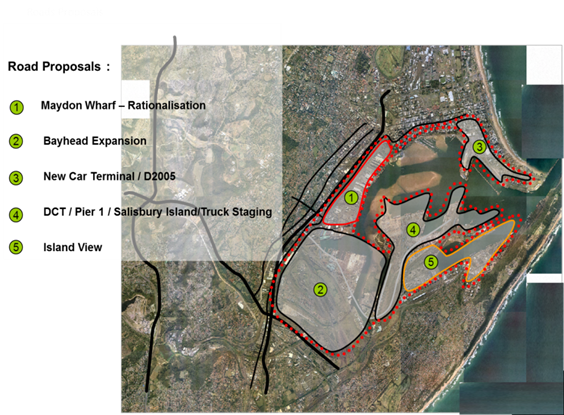
Diagram: Traffic Movement System as influenced by Road and Investments - TNPA 2010
Additional road improvements projects have been proposed in line facilitate proposed medium and longer term port capacity projects such as:
- Maydon Wharf Rationalisation
- New Car Terminal /D 2005
- DCT/Pier 1/Salisbury Island and Truck Staging; and
- Island View
Finally as part of future container capacity, Bayhead expansion is still under feasibility analysis to determine environmental, design and operational parameters. Inclusive to this is having functional inland/surface (road and rail) linkages. Bayhead Road Widening and Truck Staging projects form a critical component of the development.
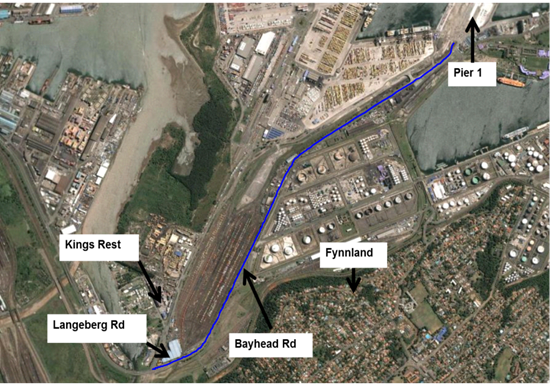
Diagram: Bayhead Road WideningSource TNPA 2010
Rail Network
Transnet Freight Rail is the only rail service provider to the Port of Durban via the Bayhead Marshalling yard, which is supplemented by the Kings Rest Marshalling yard and smaller Maydon Wharf and Point yards. The Bayhead yard is currently underutilised and the Kings Rest yard is the de facto main marshalling yard for Pier 1, 2 and Island View.
This internal network is connected to the main line between Durban and Johannesburg via the central portion of the Umlazi-KwaMashu rail trajectory and to the Richards Bay and Durban line via the northern portion of the Umlazi-KwaMashu trajectory.
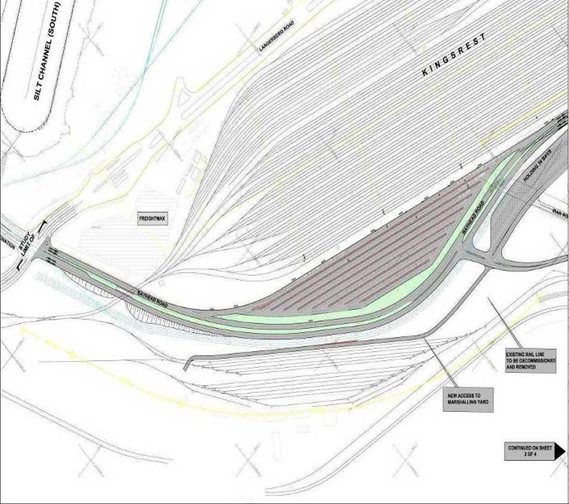
Diagram: Truck Staging - Bayhead Road (see rail rationalisation process) - Source TNPA 2010
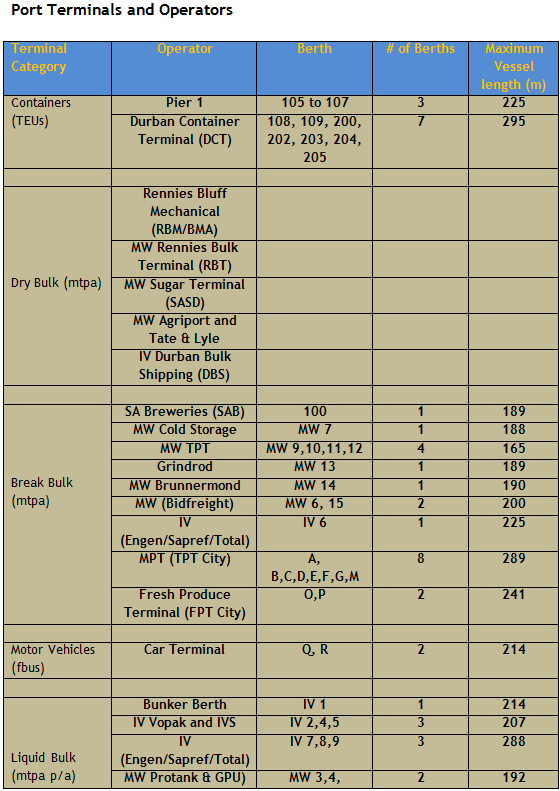
Port Terminals
The port has 58 berths and 20 terminals. Approximately 45% of South Africa's break-bulk cargo and over 61% of all containers move through the port annually. On average 200,000 containers per month are handled at the port's terminals.
Port Activity - Vessel Arrival and Cargo Handled
In 2009, over 6 Million TEUs were handled at the Port of Durban. The port is renowned for being both the sub-continent and the country's busiest port as is evident by the number of containers and general cargo handled each year which approximate 31,4 million tons of cargo worth more than R50 billion each year. Forty four per cent of South Africa's break-bulk cargo and 61 %of all containerised cargo flows through the Port with an average of 83, 000 containers per month handled at the container terminals. Economic impact of the port can be quantified by the number of employment opportunities which correlated to 6 000 direct employment and approximately 30, 000 people depending upon the port and its associated activities.
Vessel Arrivals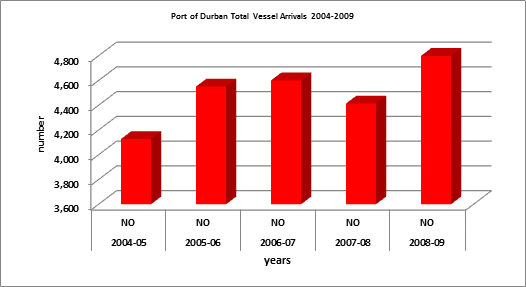
Source: TNPA-Durban 2010 and TNPA webpage 2011
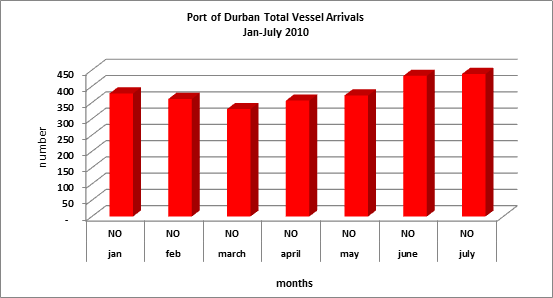
Source: TNPA-webpage 2011
Observations:Total vessel arrivals from the lowest count of 4,128 in 2004-05 to a high 4,799 in 2009, At the time of the project study (2011) recorded statistics available for collection and analysis were for Jan-July 2010, which indicated vessel arrivals at 2,667. Assumption is that figures by year-end were higher than figures logged in 2009 due to numerous international events (FIFA World Cup); demand for raw materials and consumables.
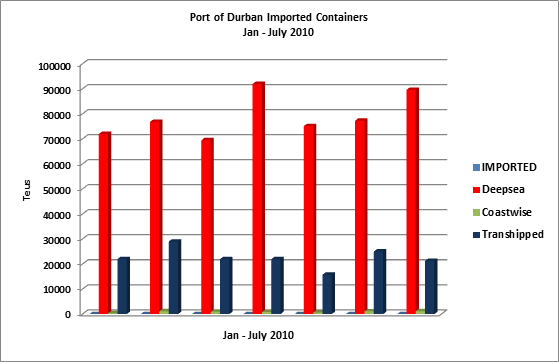
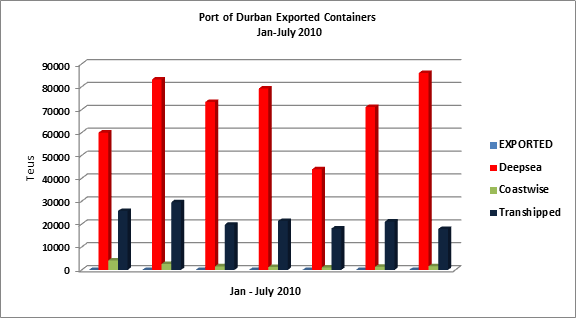
Container Volumes
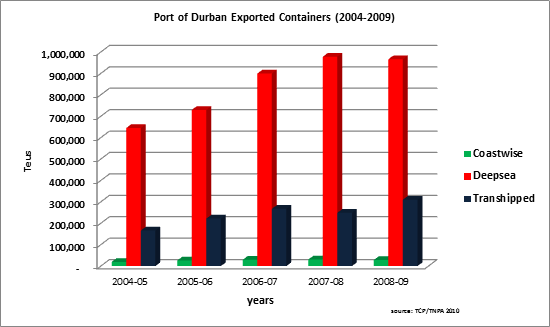
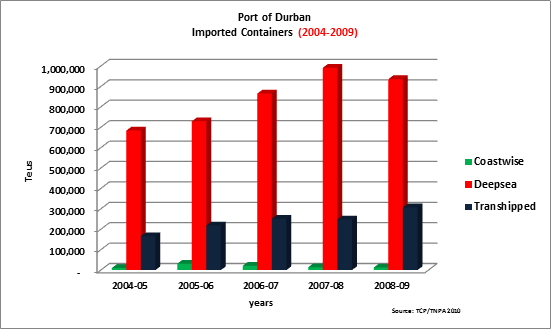
Between 2004 and 2009 there was a positive trend towards landed (imported) and exported (Teus) containers. There seems to have been a unique experience where balance of trade actually happened in this category. Similarly, the increase in transhipments has grown from 166, 255 in 2004-05 to 307,343 in 2008-09(imports) and 166, 205 in 2004 and 310,135 in 2009 (exports).
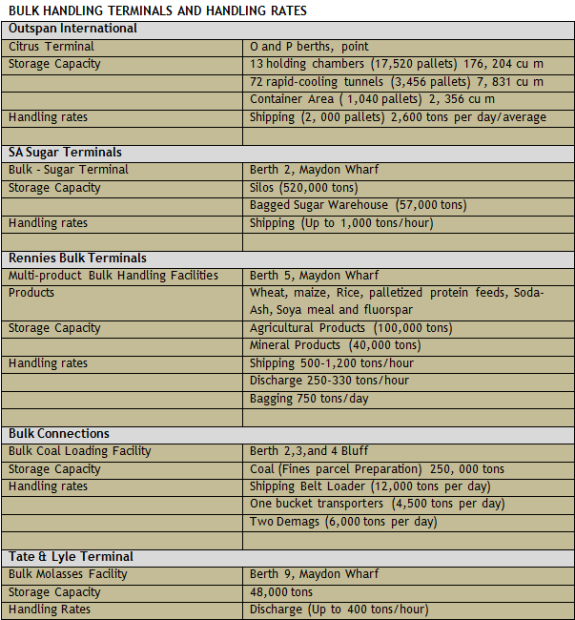
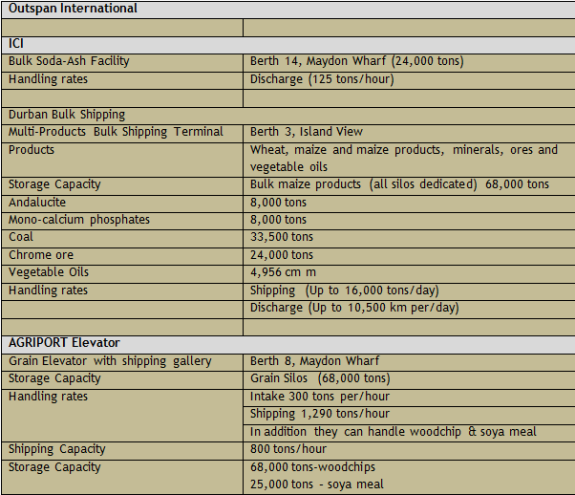
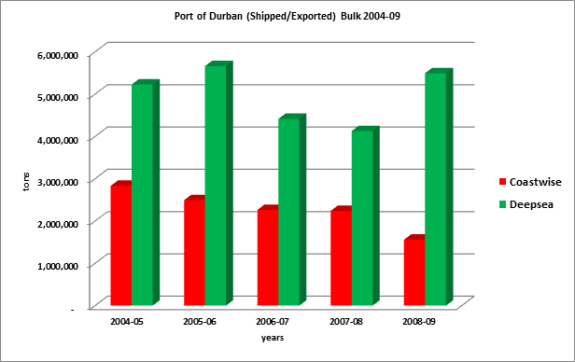
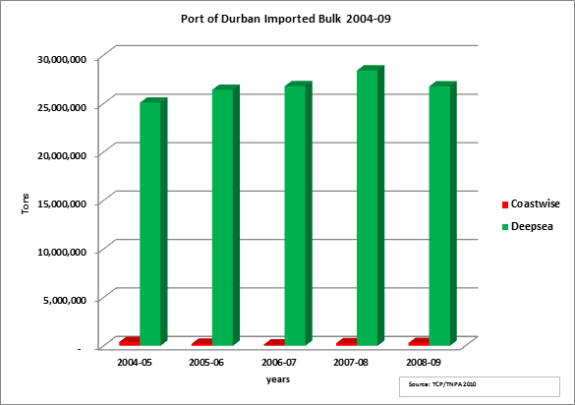
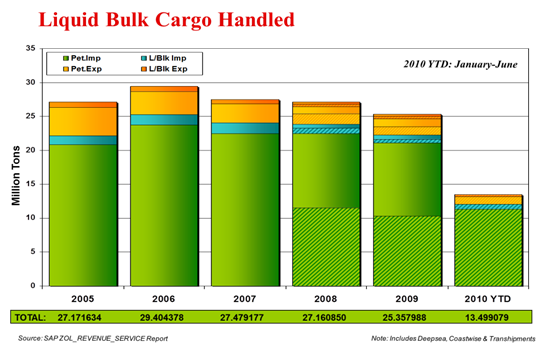
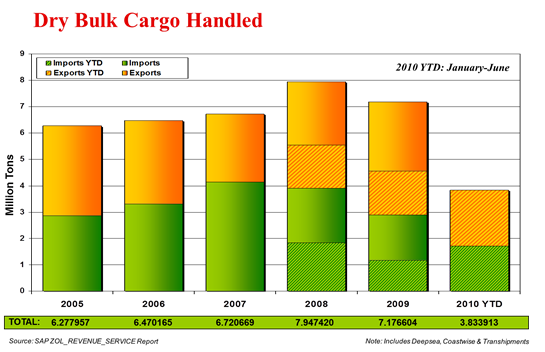
Bulk Volumes
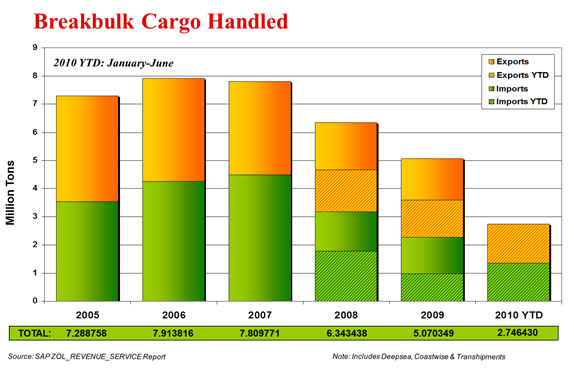
Break-Bulk Volumes
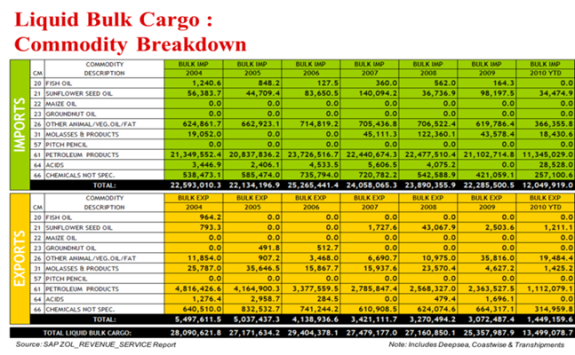
Liquid Bulk: Commodity Breakdown 2004 - June 2010
Dry Bulk Commodity Breakdown 2004 - June 2010
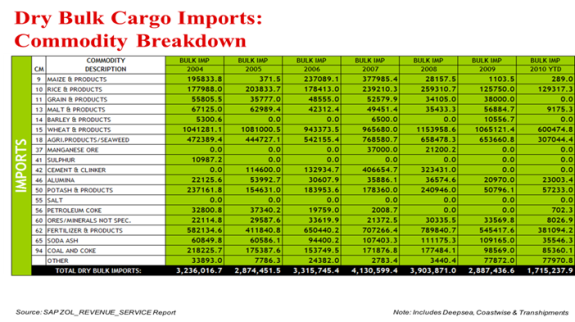
Top Commodities Imported (2010 YTD)

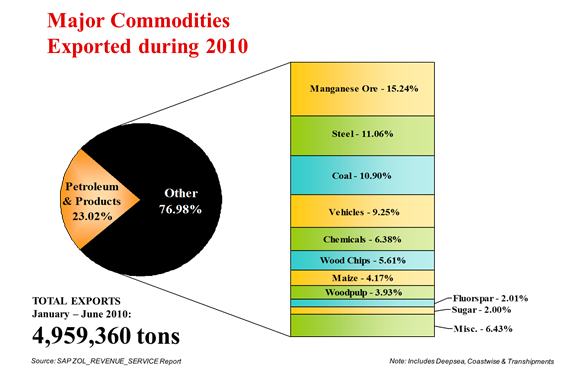
Top Commodities Exported (2010 YTD)
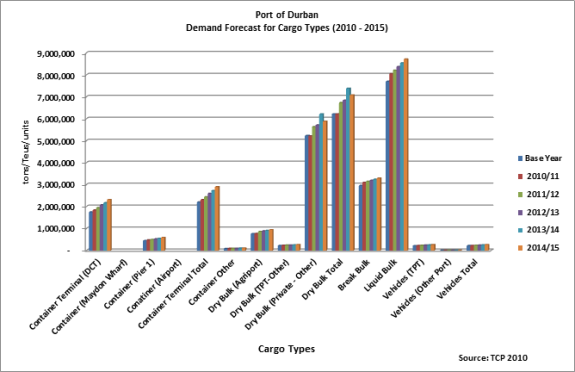
Demand Forecast (2010-2015)
Port Demand Framework and Assumptions (source: National Infrastructure Plan by Transnet (2009 and 2010))
The basic principles applied for developmental (spatial distribution; forecasting, etc.) planning purposes are as follows:
- Capacity Calculation = port transhipment + import + export + empties
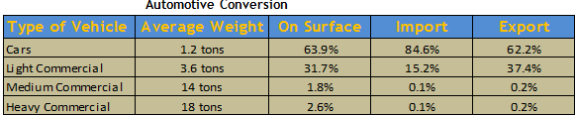
For Automotive sector, forecasting is conducted in tons. The conversion to units is as follows:
Automotive Conversion
- Corrective forecasting measures were applied in 2007/08. Predictably, growth has been affected by the world recession, thus infrastructure in most instances has been developed too ahead of demand. A moderate and balanced approach to mitigate against (low and high) growths has been to merge the short term fluctuation in the growth of the economy with the long term 30 year forecast.
- Of importance to note is the unique grouping of cargoes used in South Africa vs. those in Europe. Instead of a 62 commodity system, South Africa utilises a 92 commodity system. This is best observed in projected bulks (break, dry and liquid). To achieve better comparability total volumes per cargo are proportionally distributed across the port system. In the following graphs there is SA Ports imports (based on 62 commodity system) vs. NPA SA imports adjusted according to NPA type split.
- ·The demand forecast is for the next 4-5 years (2010- 2015).
Observations:
Deviations exist between break-bulk compared to dry and liquid bulk overall even though, dry bulk figures are still the highest, a testimony to the national status as a mineral-driven producer. The totals for import and export are comparable. Only the split of the three package type is significantly different. (Source: NIP - Transnet Capital Projects - 2010)
According to Transnet, dry bulk cargoes and their projected growth and movement will be dependent on Transnet Freight rail (TFR) expansion program, i.e. coal and iron ore, etc. will be capped at tons that TFR can meet. These volumes in turn will be dictated by demand (market and prices).
The port continues to play an important role within the regeneration and competitiveness of the national and regional economy. In this regard, the Port Authority has a mandate to ensure that infrastructure is developed ahead of demand with critical performance measures for greater productivity and producing a consistent rate of return.
What can be observed at the port is that operational challenges and market forces play a determinant factor to the port's ability to meet targets set by either the broader Transnet machinery and/or stakeholders such as cargo owners, the city and the State. The balancing act required to meet some of these expectations can produce frustrations from all quarters, but what is of importance is to embrace the unique stature the port has in the region and in Africa as a whole. Secondly, international markets do dictate supply and demand of some key goods moving through the port; i.e. the global troubles of the auto industry have resulted in a decline of 24% of auto units overall in 2009/2010 in the port; container volumes have dropped by 4.5% during the same period, despite the spikes observed due to the FIFA World Cup. Mostly felt at the port was the strike that derailed some business in the area, as far as Gauteng Province. This is a testament of the commercial role the port has nationally and regionally.
In conclusion, cargo volumes will steadily increase overtime as reflected in the national demand forecast where an optimistic average growth of 11.3% is anticipated over the next +/-30 years. Tons/per car are anticipated to have a growth factor of 1.5% during the same period (this demonstrates a less than healthy outlook for the industry at large.). For other commodities like break-bulk, anticipation is for continued steady growth, maybe not as healthy as what 2009/2010 registered at 12%....but this could remain steady at this growth with an additional 2-3% increase as more dry-bulk cargo migrates to being handled as break-bulk and some migrates into containerization.
Main Menu

Other Links
Copyright © 2012 Limpopo Province Freight Transport Data Bank | Developed and Powered by Safiri South Africa.